When you start self-hosting more than one service, monitoring becomes very important.
At first, it is easy to check everything manually. You open your website, check your dashboard, SSH into the server, run a few commands, and hope everything is fine.
But once you have multiple services running, manual checking is not enough.
I wanted a simple way to know:
Is my video server online?
Is my reverse proxy working?
Is my admin dashboard protected?
Are my virtual machines reachable?
Is my monitoring server itself healthy?
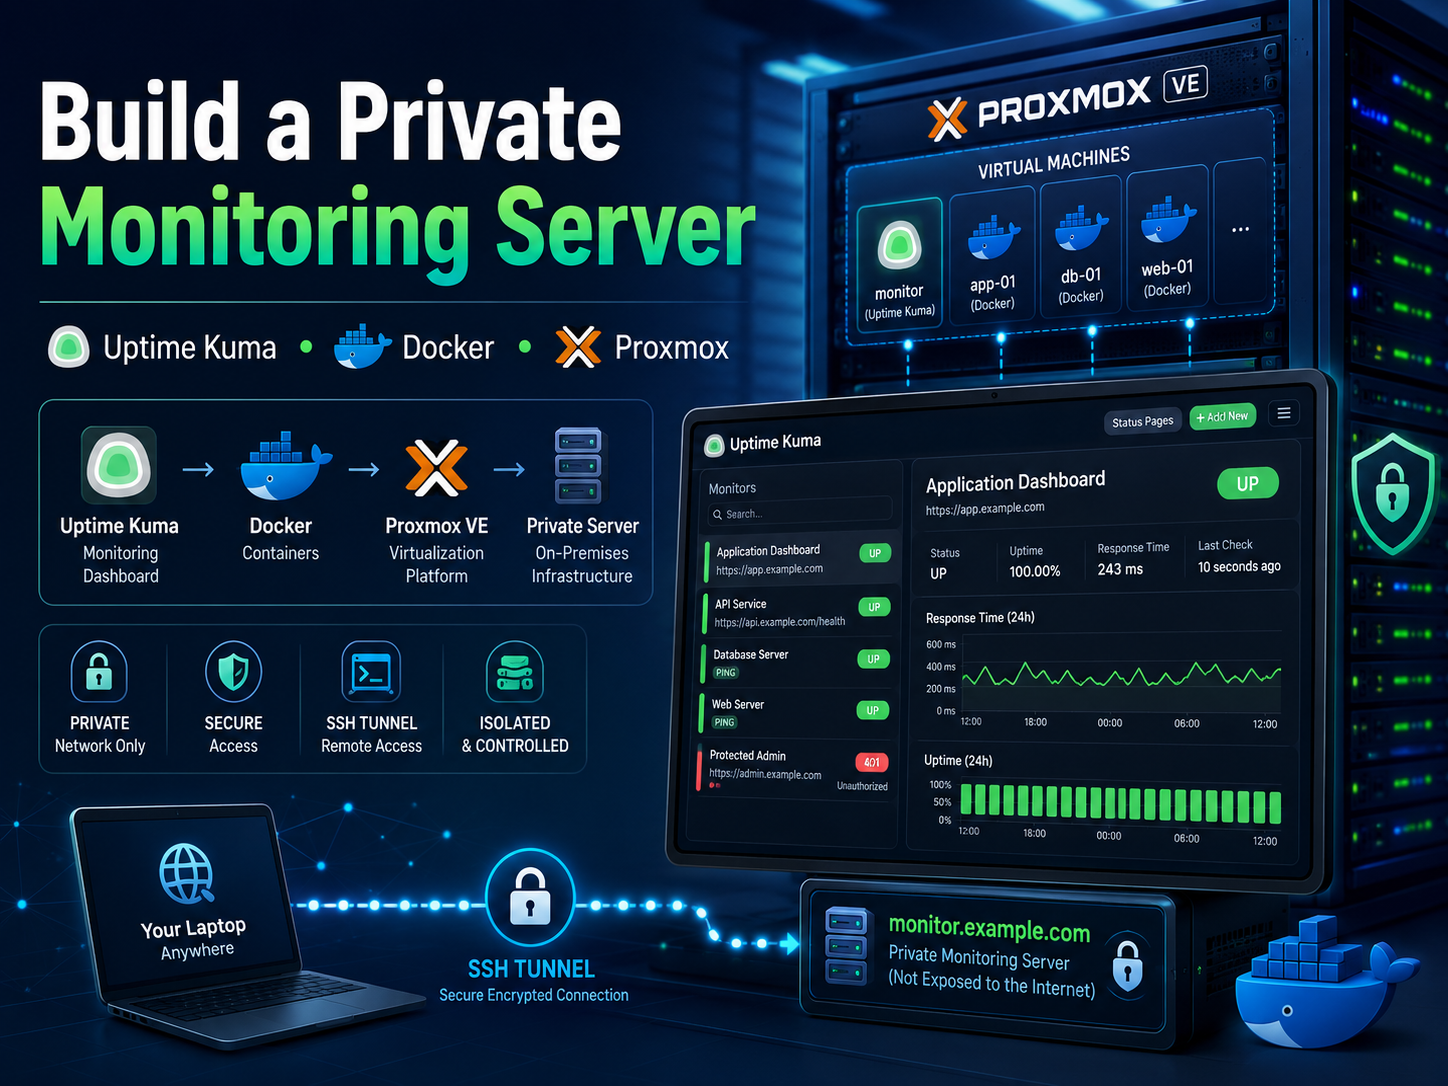
For this, I built a dedicated private monitoring server using Uptime Kuma.
This article explains what Uptime Kuma is, why I installed it on a separate VM, how the architecture works, and the main lessons I learned while building it.
What Is Uptime Kuma?
Uptime Kuma is an open-source monitoring tool that lets you watch websites, servers, APIs, ports, and internal services from a clean web dashboard.
It can monitor things like:
HTTPS websites
Internal HTTP services
Ping checks
TCP ports
Docker services
SSL certificate status
Login-protected dashboards
It gives you a visual dashboard showing what is:
UP
DOWN
Pending
Slow
Unavailable
It can also send alerts later through email, Telegram, Discord, Slack, webhooks, and other notification channels.
In simple words, Uptime Kuma is like a watchman for your server.
Instead of wondering whether your services are working, you open one dashboard and see the status clearly.
Why I Used a Separate VM for Monitoring
I did not want to install monitoring directly on the Proxmox host.
The Proxmox host should stay clean. It should only run virtualization, storage, networking, and core host services.
So I created a separate virtual machine just for monitoring.
Example architecture:
Proxmox Host
│
├── VM 100 — Docker / Traefik / Portainer
├── VM 101 — Video meeting server
└── VM 102 — Monitoring / Uptime Kuma
This separation is useful because the monitoring VM can watch the other VMs without mixing workloads.
The monitoring VM stays lightweight and focused.
It does not run video meetings.
It does not run the reverse proxy.
It does not run the main application stack.
It only monitors.
My Monitoring VM Design
For the monitoring VM, I used a small Debian server.
Example VM specification:
OS: Debian 12
CPU: 2 vCPU
RAM: 4 GB
Disk: 80 GB
Network: private bridge
Access: private only
Monitoring app: Uptime Kuma
Runtime: Docker + Docker Compose
This is more than enough for a small monitoring dashboard.
The goal was not to build a heavy server. The goal was to build a reliable control point that can monitor other services and later help with backup checks.
Why I Kept Uptime Kuma Private
One important decision: I did not expose Uptime Kuma publicly at first.
The dashboard was only reachable through the private server network.
Example:
Uptime Kuma private address:
http://10.0.10.20:3001
From my computer, I accessed it through an SSH tunnel:
ssh -N -L 13001:10.0.10.20:3001 [email protected]
Then I opened:
http://localhost:13001
This gave me secure access without creating a public dashboard.
That is the safest starting point.
Later, it is possible to expose the dashboard through a protected subdomain like:
monitor.example.com
But I recommend doing that only after adding strong protection, such as:
Reverse proxy basic authentication
Uptime Kuma login
VPN or IP allowlist
Strong passwords
HTTPS
A monitoring dashboard tells a lot about your infrastructure. Do not expose it casually.
Installing Uptime Kuma with Docker Compose
The basic Docker Compose idea is simple.
Example folder:
/opt/monitoring/uptime-kuma
Example compose.yaml:
services:
  uptime-kuma:
    image: louislam/uptime-kuma:2
    container_name: uptime-kuma
    restart: unless-stopped
    volumes:
      - ./data:/app/data
    ports:
      - "10.0.10.20:3001:3001"
A few important details:
The data folder is very important:
./data:/app/data
That folder stores:
Dashboard users
Monitor settings
History
Notification settings
Database files
Do not delete it unless you intentionally want to reset Uptime Kuma.
Start it with:
docker compose up -d
Check it with:
docker compose ps
A healthy container should show something like:
uptime-kuma Up healthy
The First Setup Page
After the container starts, open the dashboard through your private access method.
Example:
http://localhost:13001
On first launch, Uptime Kuma asks you to create an admin account.
Use a strong password and save it safely.
For a simple self-hosted setup, the default SQLite option is fine.
The First Monitors I Added
After the dashboard was ready, I added basic monitors.
Example monitors:
Main Public Website
Internal Application Web Check
Reverse Proxy Auth Check
Admin Dashboard Auth Check
VM 100 Ping
VM 101 Ping
VM 102 Ping
Monitoring Self Check
Private Gateway Ping
For HTTP checks, Uptime Kuma can verify status codes.
For example, a normal public website should return:
200 OK
But a protected dashboard may return:
401 Unauthorized
That can actually be a good result.
If a dashboard is supposed to be protected by basic authentication, then 401 Unauthorized means:
The service is reachable
The protection layer is working
The dashboard is not openly exposed
So in Uptime Kuma, I created some monitors where the accepted status code is:
401
This is useful for checking protected admin tools.
The Hairpin NAT Problem
One issue I ran into was internal monitoring of public domains.
From outside the server, a domain like this may work:
https://app.example.com
But from inside a private VM, the same domain may resolve to the public server IP and fail.
This is often because of hairpin NAT or loopback NAT.
In simple terms:
Private VM
→ public domain
→ public IP of same server
→ tries to loop back inside
→ connection fails
The service was not actually down. The private monitoring VM just could not reach it using the public path.
To solve this, I forced the Uptime Kuma container to resolve certain public service domains to the private reverse proxy IP.
Example:
extra_hosts:
  - "app.example.com:10.0.10.10"
  - "dashboard.example.com:10.0.10.10"
  - "admin.example.com:10.0.10.10"
After recreating the container, Uptime Kuma could monitor those domains through the internal network while still using the real HTTPS hostname.
This is a very useful trick for private monitoring behind a reverse proxy.
Example Final Compose File
Here is a generalized example:
services:
  uptime-kuma:
    image: louislam/uptime-kuma:2
    container_name: uptime-kuma
    restart: unless-stopped
    volumes:
      - ./data:/app/data
    ports:
      - "10.0.10.20:3001:3001"
    extra_hosts:
      - "app.example.com:10.0.10.10"
      - "reverse-proxy.example.com:10.0.10.10"
      - "dashboard.example.com:10.0.10.10"
In this example:
10.0.10.20 = monitoring VM
10.0.10.10 = reverse proxy VM
Use your own private IPs and domains.
Do not publish private details in public tutorials.
Useful Maintenance Commands
Check the container:
cd /opt/monitoring/uptime-kuma
docker compose ps
View logs:
docker logs --tail 50 uptime-kuma
Restart Uptime Kuma:
cd /opt/monitoring/uptime-kuma
docker compose restart
Update Uptime Kuma:
cd /opt/monitoring/uptime-kuma
docker compose pull
docker compose up -d
Test the private web port:
curl -I http://10.0.10.20:3001
Test a monitored domain from inside the container:
docker exec uptime-kuma curl -Ik https://app.example.com
Check whether a domain resolves correctly inside the container:
docker exec uptime-kuma getent hosts app.example.com
Why I Took Snapshots During the Build
Before major changes, I took Proxmox snapshots.
Example snapshot stages:
clean-debian-base
docker-installed-before-monitoring
uptime-kuma-working-private
This made the build safer.
If something broke, I could roll back to a known good point.
However, snapshots are not the same as real backups.
A snapshot stored on the same server is useful for rollback, but it does not protect you if the whole server or storage pool fails.
For real disaster recovery, you still need off-server backups.
A better future backup plan would include:
Proxmox VM backups
Off-server storage
Backup verification
Backup pruning
Backup success/failure monitoring
Alert notifications
What Uptime Kuma Does Not Replace
Uptime Kuma is excellent for availability monitoring, but it does not replace everything.
It does not replace:
Full server backups
Security hardening
Firewall rules
Log management
Intrusion detection
Disaster recovery planning
Application-level debugging
It tells you when something is down or unhealthy.
Then you still need good maintenance practices to fix the problem.
Should Uptime Kuma Be Public?
My recommendation: start private.
Use SSH tunnel or VPN first.
Expose it publicly only if you really need it, and only with multiple protection layers.
A safe future setup might look like:
https://monitor.example.com
Protected by:
HTTPS
Reverse proxy authentication
Uptime Kuma login
VPN or IP allowlist
Strong admin password
For public visitors, use a separate public status page instead of exposing the admin dashboard.
For example:
https://status.example.com
That page can show limited public information without exposing the full monitoring admin panel.
Best Services to Monitor First
Start simple.
Good first monitors:
Main website HTTP check
Internal app HTTP check
Reverse proxy dashboard auth check
Admin dashboard auth check
Main VM ping checks
Monitoring server self-check
Private gateway ping
SSL certificate check
Later, add more advanced checks:
Backup success/failure check
Disk usage check
Database health check
Docker container check
Video service internal check
TURN/STUN service check
API endpoint check
Notification delivery test
Do not try to monitor everything on day one.
Build a clean foundation first.
Lessons Learned
The biggest lessons from this build:
Keep monitoring separate from main services.
Do not install monitoring on the Proxmox host.
Keep the dashboard private at first.
Use Docker Compose for clean deployment.
Take snapshots before major changes.
Do not confuse snapshots with real backups.
Use 401 Unauthorized as a healthy result for protected dashboards.
Watch out for hairpin NAT when monitoring public domains from inside a private network.
Add alerts after the basic dashboard is stable.
Final Thoughts
Uptime Kuma is one of the easiest and most useful tools to add to a self-hosted infrastructure.
It gives you visibility.
Instead of guessing whether your services are working, you can see the status in one place.
For my setup, the best approach was:
Dedicated monitoring VM
Debian server
Docker Compose
Private Uptime Kuma dashboard
SSH tunnel access
Internal service checks
Protected dashboard checks
Snapshots before major changes
The next important step is alerting.
A dashboard is helpful, but alerts are what tell you something is wrong when you are not looking.
For production, I would add:
Telegram alerts
Email alerts
Backup monitoring
Disk usage checks
Off-server backup verification
Monitoring is not the end of server maintenance, but it is one of the best foundations you can build early.
FAQ
What is Uptime Kuma used for?
Uptime Kuma is used to monitor websites, servers, APIs, ports, and internal services. It shows whether each service is up or down and can send alerts when something fails.
Is Uptime Kuma free?
Yes. Uptime Kuma is an open-source self-hosted monitoring tool.
Can Uptime Kuma monitor private services?
Yes. If Uptime Kuma runs inside your private network, it can monitor private IP addresses, internal services, and private dashboards.
Should I expose Uptime Kuma to the internet?
It is better to keep it private at first. Use an SSH tunnel or VPN. If you expose it later, protect it with HTTPS, reverse proxy authentication, Uptime Kuma login, and preferably VPN or IP allowlisting.
Can Uptime Kuma monitor Proxmox?
Uptime Kuma can monitor Proxmox-related services indirectly through ping checks, HTTPS checks, port checks, and custom scripts. It is not a full Proxmox management replacement.
Why does my public domain fail from inside my server?
This can happen because of hairpin NAT or loopback NAT. The internal VM resolves the public domain to the public IP, then fails to loop back into the same server. One solution is to use internal DNS or Docker extra_hosts to point that domain to the private reverse proxy IP.
Is a Proxmox snapshot a backup?
No. A snapshot is a local rollback point. A real backup should be copied off-server to separate storage.
What should I monitor first?
Start with your main website, reverse proxy, key internal services, VM ping checks, the monitoring server itself, and protected dashboard checks.